REIQ quarterly market monitor report for our Fraser Coast
We’re off to a very busy start to the year and I can’t believe its April already!
We have now got all of our core business tools in place for Mitchell’s Realty Hervey Bay which launched on the 5th of January 2016. We have listed 45 properties and placed 6 under contract to date and have noted better buyer interest in the last week.
As a “best practice” REIQ member we are able to provide you with this detailed Fraser Coast Market Monitor quarterly report as follows and suggest that there has never been a better time to invest in Hervey Bay.
SALES MARKET DATA
All figures for the most recent quarterly and yearly periods are preliminary only and subject to further revision as additional sales records become available (see Research Methodology online at reiq.com).
As of the June quarter 2013, all sales data includes “Recent Sales” as advised by real estate agents as well as official records as advised by DNRM. As such comparisons with figures published prior to the June quarter 2013 should be done with caution.
A median sale price is derived by arranging a set of sale prices from lowest to highest and then selecting the middle value within this set (ie the 50th percentile, where half of recorded sales were less and half were higher than the median).
RENTAL MARKET DATA
All median weekly rents are published on a postcode basis, as calculated by the Residential tenancies Authority, where sufficient data is available.Caution should be exercised when interpreting any median rental price data based upon a relatively small number of new bond lodgements. Figures for the new LGA’s available for the current quarter only.

 r
r
ON THE MARKET INDICATORS
At the time of publication, latest information available was for the 12 months ending the month prior to the current period.
“Days on Market” is calculated as the average number of days it has taken to sell those properties sold by private treaty sale during the 12 month period. The calculation excludes auction listings and listings where an asking price is not advertised. The days on market calculation uses the contract date on the property compared with the first advertised date.
“Vendor Discount” is the average difference between the contract price on a property and the first advertised price.
The figure is expressed as a percentage and is an average of all private treaty sales which sold for less than their initial asking price during the last 12 months. Auction listings, listings without an advertised asking price and properties sold at or above list price are excluded from the calculation.
“Total Listings” is the total unique number of properties that have been advertised for sale and captured by RP Data over the 12 month period. To be included in the count, the listings have to be matched to an actual address.
“% Stock on Market” is the percentage of dwellings within the suburb or local government area that have been listed for sale over the past year. Source: REIQ, data supplied by CoreLogic RP Data (www.corelogic.com.au)
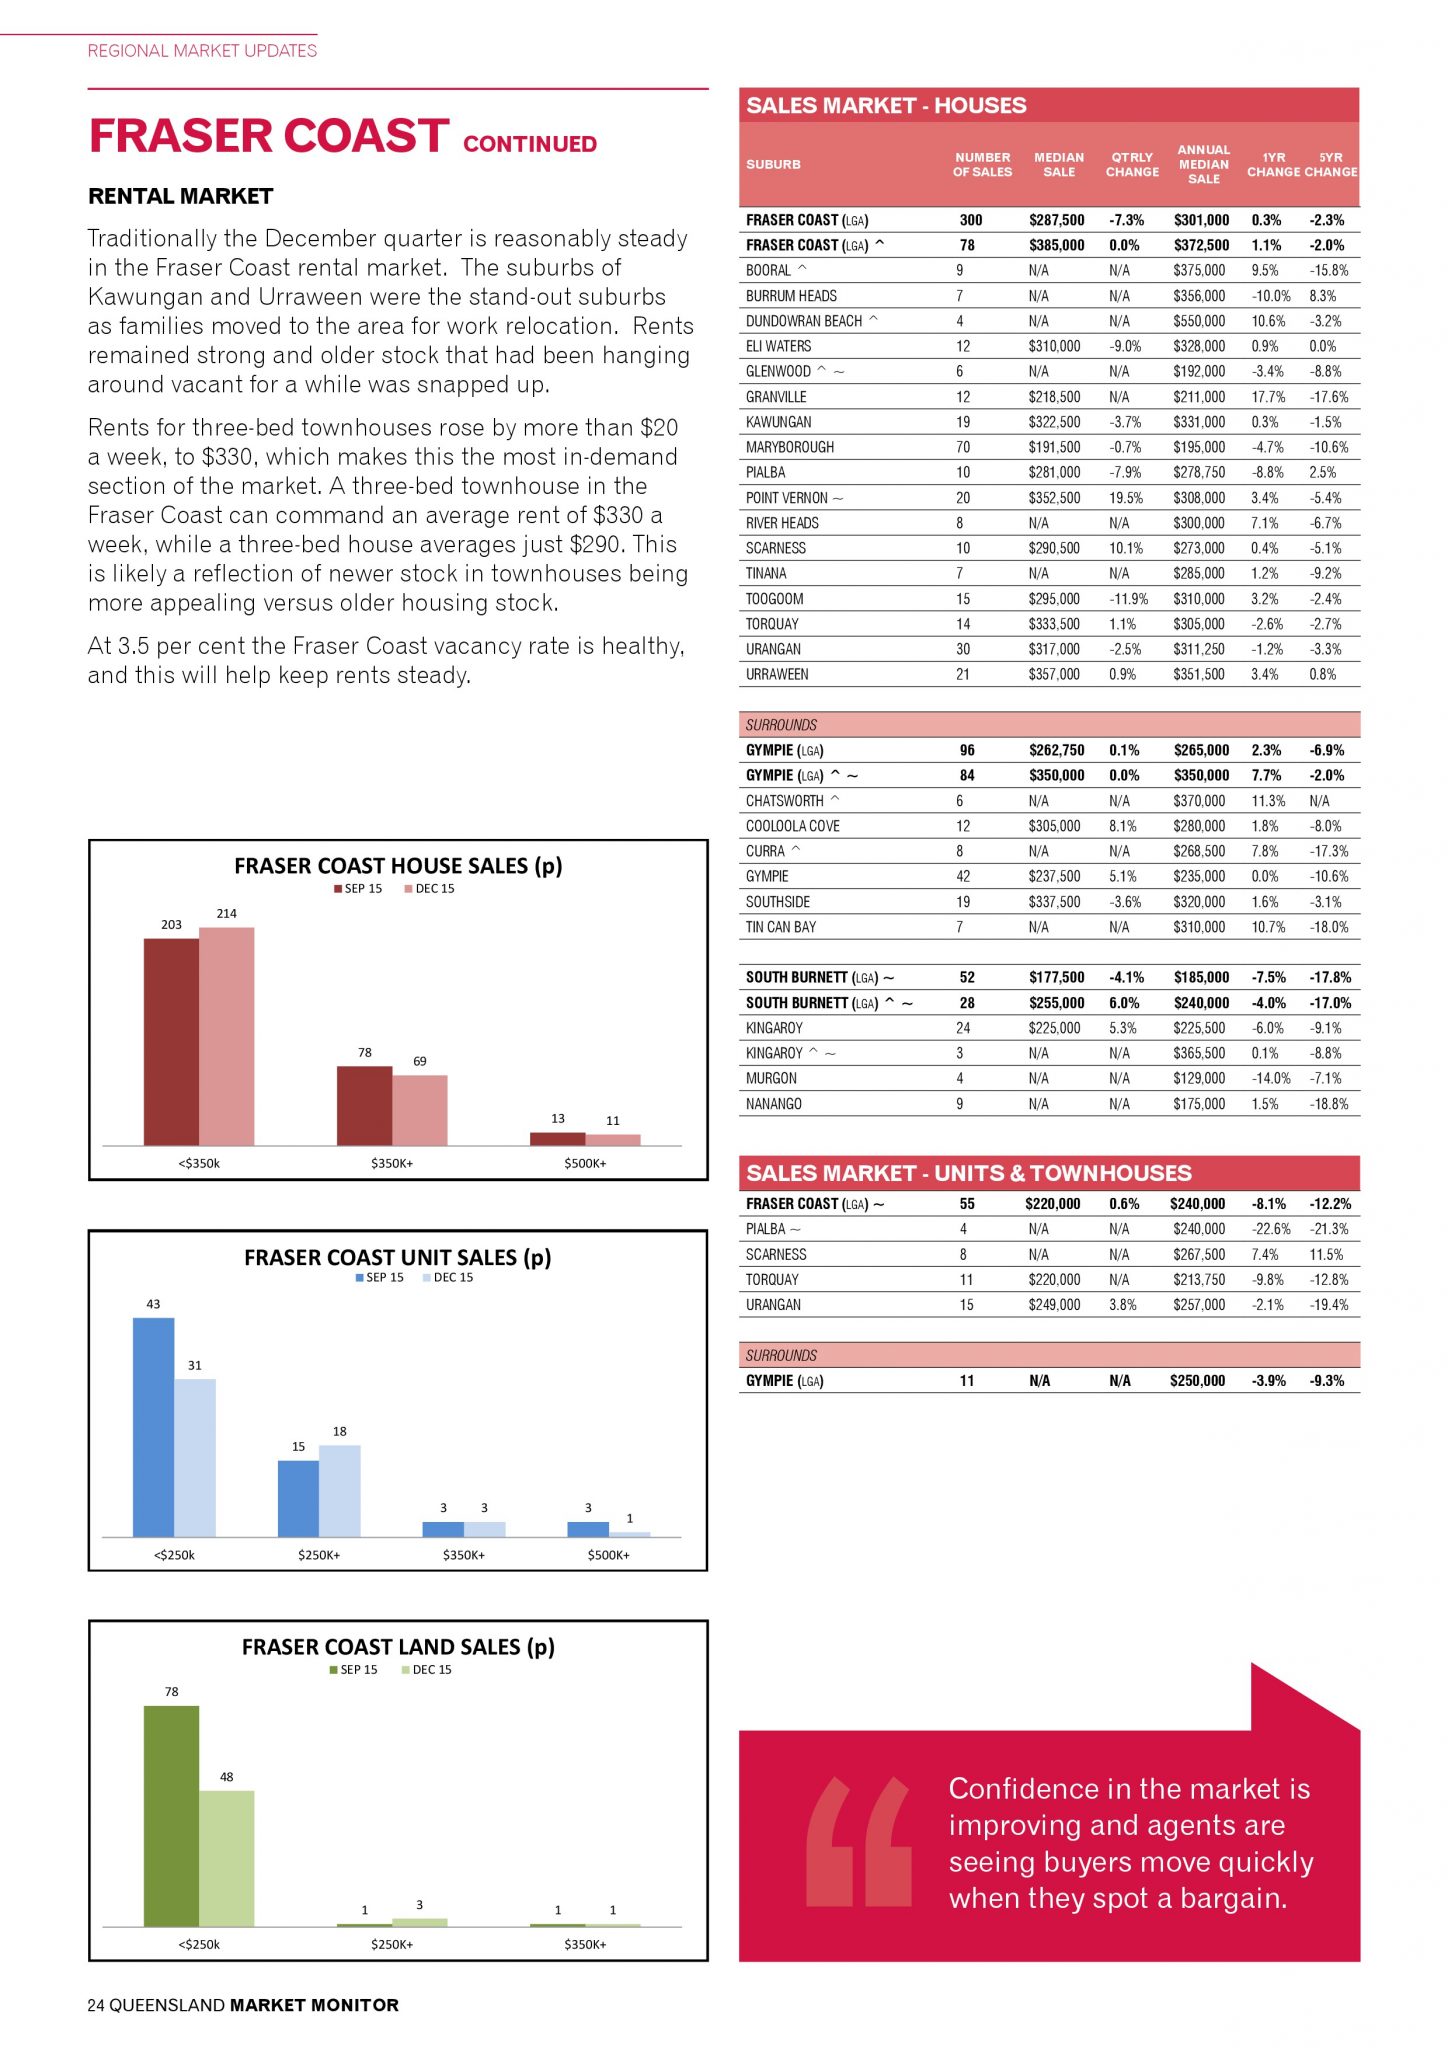
PRICE POINT GRAPHS
All data contained within these graphs represent preliminary sales numbers and are subject to revision as additional sales records become available.The data excludes any recent sales transactions where the contract sale price was not disclosed.
The intention of these graphs is to gauge trends in sales activity between periods in lieu of actual final sales results.Source: REIQ, data obtained from CoreLogic RPData Data report date: 15 February 2016 published date: 21 March 2016
Contact us now either by email – sales@mitchellsrealty.com.au or call 0428 484 499 if you would like to know where your home would sell in the current market or would like our assistance in buying property in Hervey Bay.
Until next time – Scott Mitchell