

Matusik Market Outlook for the Fraser Coast July 2016
Sponsor message The Fraser Coast Chronicle is the booming Fraser Coast region’s dedicated daily read. Featuring a vibrant mix of news and entertainment, the Fraser Coast Chronicle captures the holiday lifestyle of the region and includes coverage of local people, visitors, events, dining and business. The Fraser Coast Chronicle also features the popular Rural Weekly Wide Bay edition and Let’s Go Fishing supplements every week, an extensive lifestyle and entertainment section each weekend – vital to this high-growth area.
Executive summary
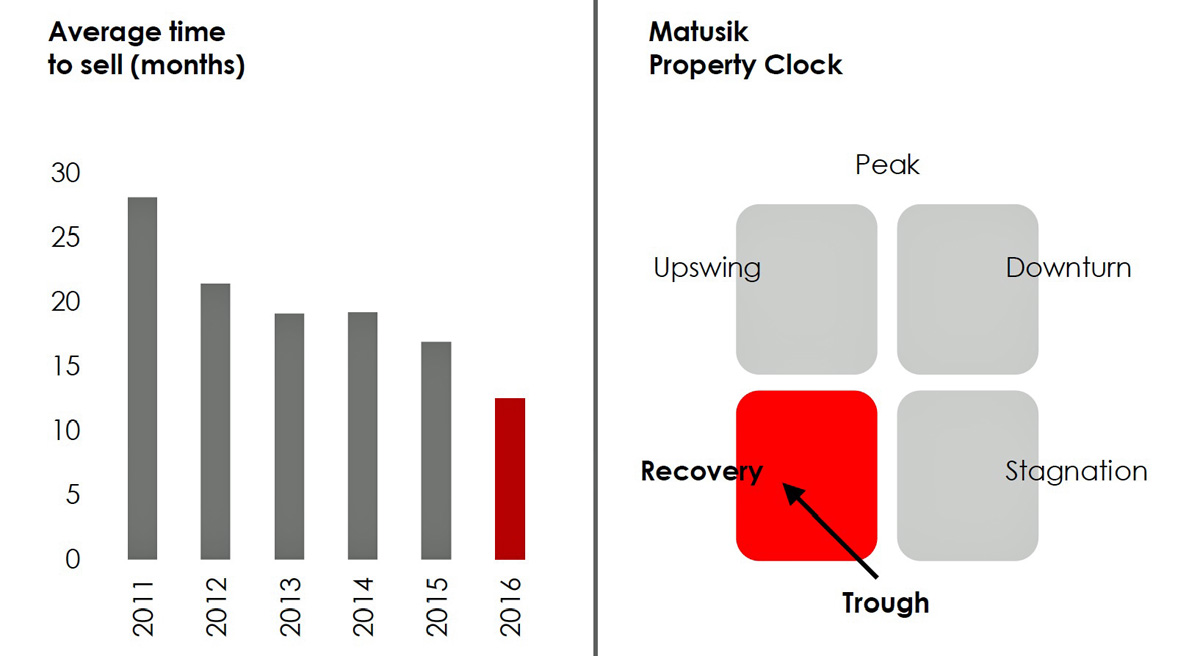
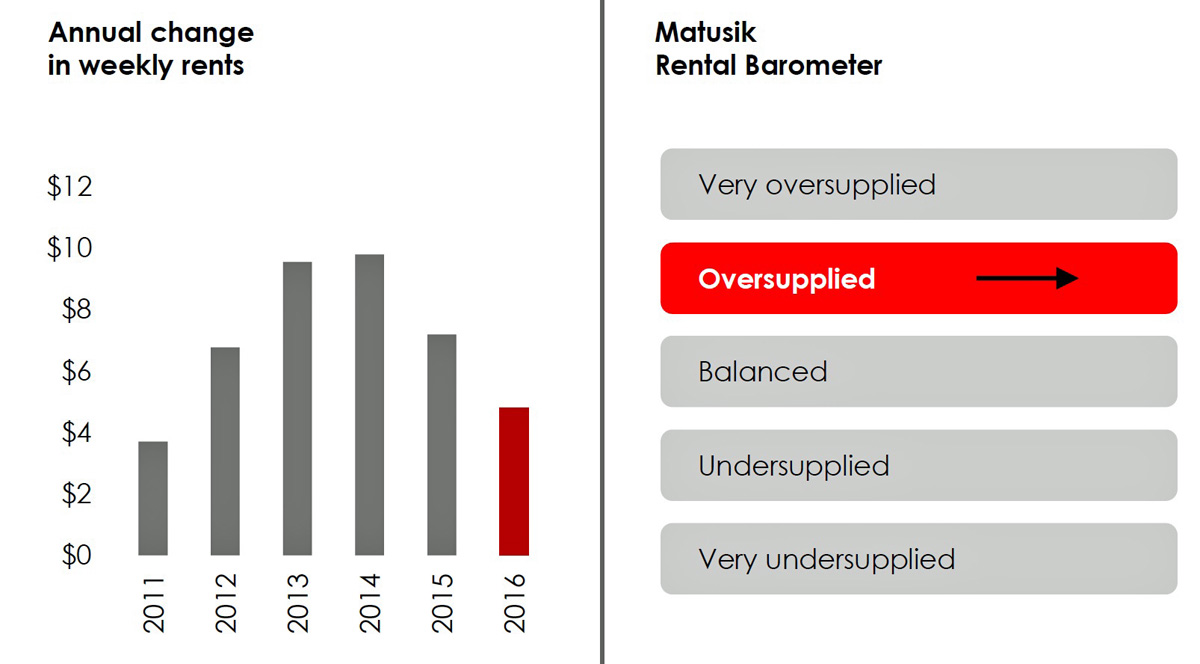
The Fraser Coast residential market is currently at the bottom on the cycle and is likely to enter a recovery during fiscal 2017. This recovery is expected to be very mild when compared to the past. Local resale supply has tightened in recent years and demand is now starting to rise. We anticipate dwelling prices across the Fraser Coast to rise by 5% over the next twelve months. There might be a small rise in weekly rents, but most are likely to remain stable during fiscal 2017. In contrast to the resale housing market, the new housing market remains very subdued. Population growth is slower than forecast, local unemployment remains persistently high and the region remains oversupplied with new homes. Looking forward, there is a need to build 450 new dwellings in the area each year. A large number of local residents should be attracted to small lot homes and dual+ income properties plus townhouses and smaller unit complexes. There is also a strong demand for retirement style product. Given the region’s economic profile, new housing needs to be affordably priced. On a more positive note, just under 750,000 people visit the Fraser Coast each year. Visitor numbers are up 12% on last year. Half of the visitors are holiday makers, with Fraser Island and whale watching in Hervey Bay being the main drawcards.

Sales market
* The Fraser Coast residential market is currently at the bottom on the cycle and is likely to enter a recovery during fiscal 2017. This recovery is expected to be very mild when compared to the past.
* The median dwelling price is around $300,000.
* Dwelling values have been rising, on average, by $7,000 or 2.7% per annum over the past ten years.
* We anticipate the average dwelling price across the Fraser Coast to rise by 5% over the next twelve months.
* A median dwelling value of $315,000 across the Fraser Coast is possible by the end of financial 2017.
Housing demand and supply
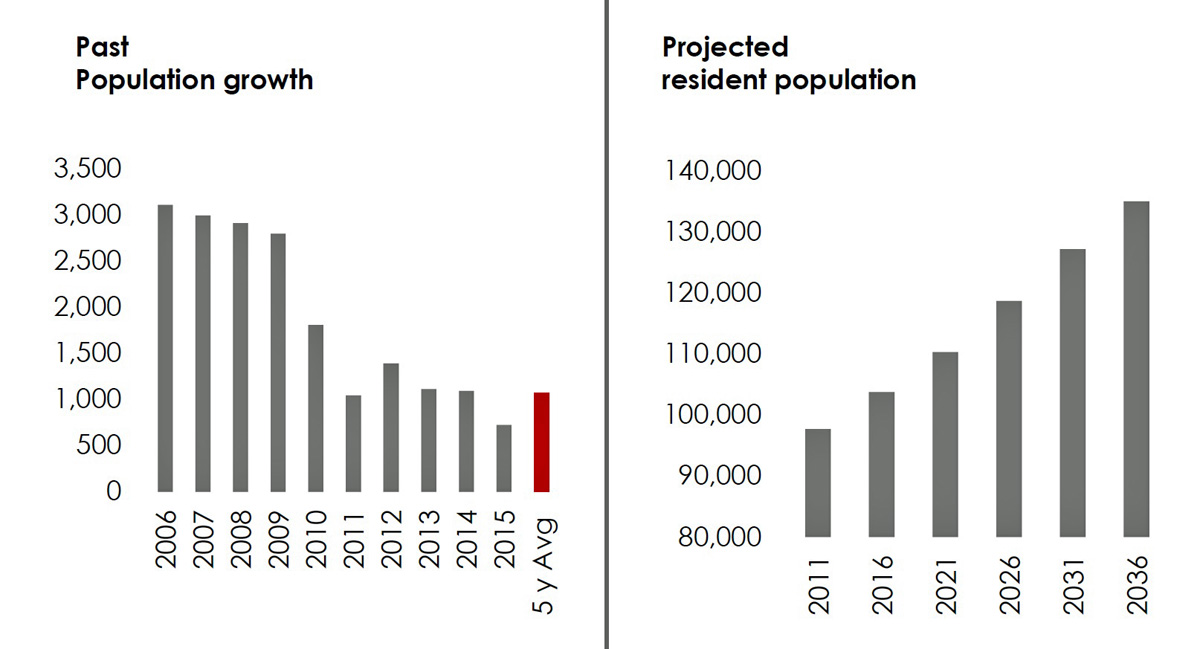
* About 100,000 live on the Fraser Coast. The area is currently growing by 1,100 new residents per annum, which is much slower (by 400 residents per annum) than the official forecast.
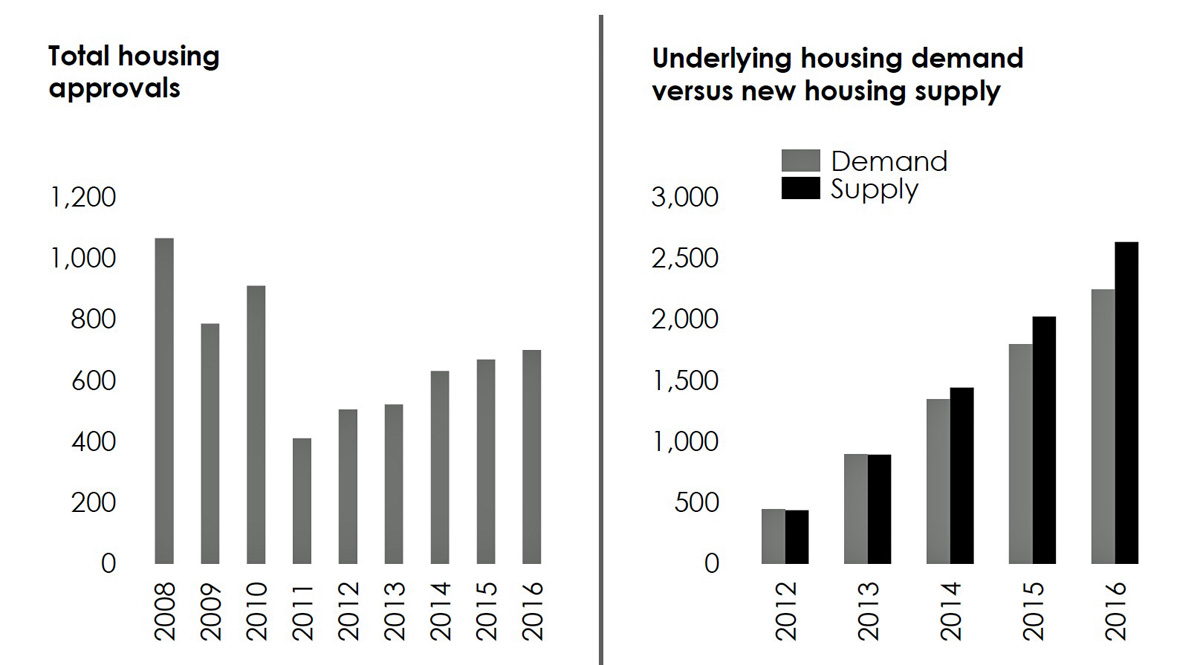
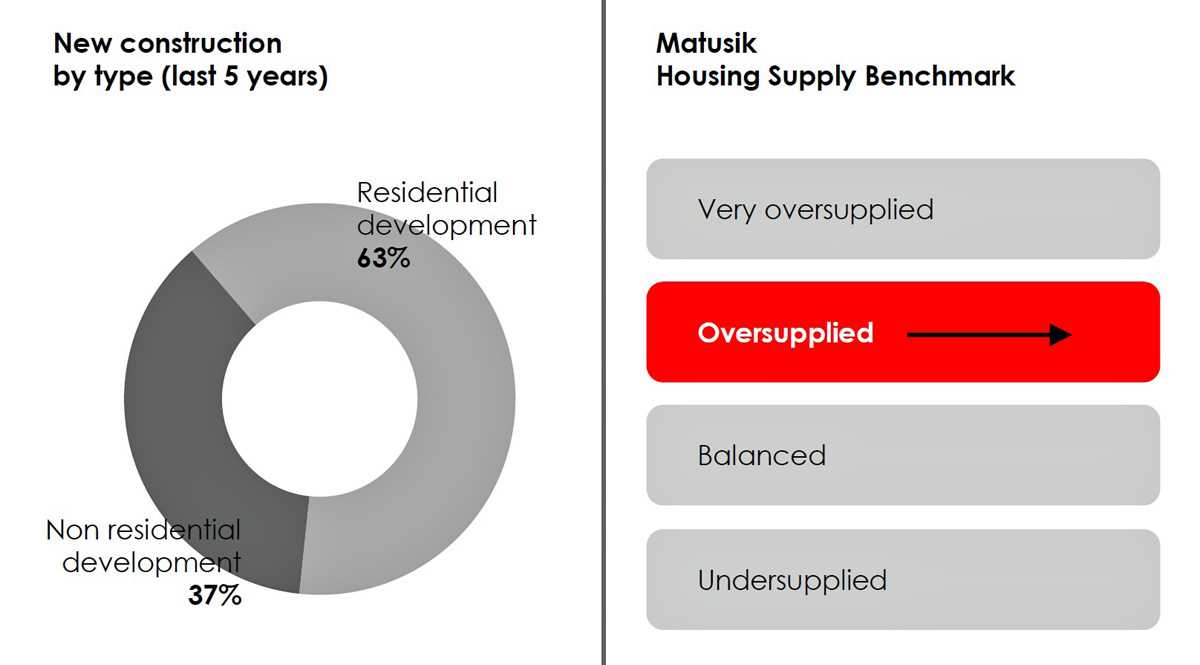
* At present there is a need to build up to 450 new dwellings across the local area each year. At present the area remains oversupplied with new homes.
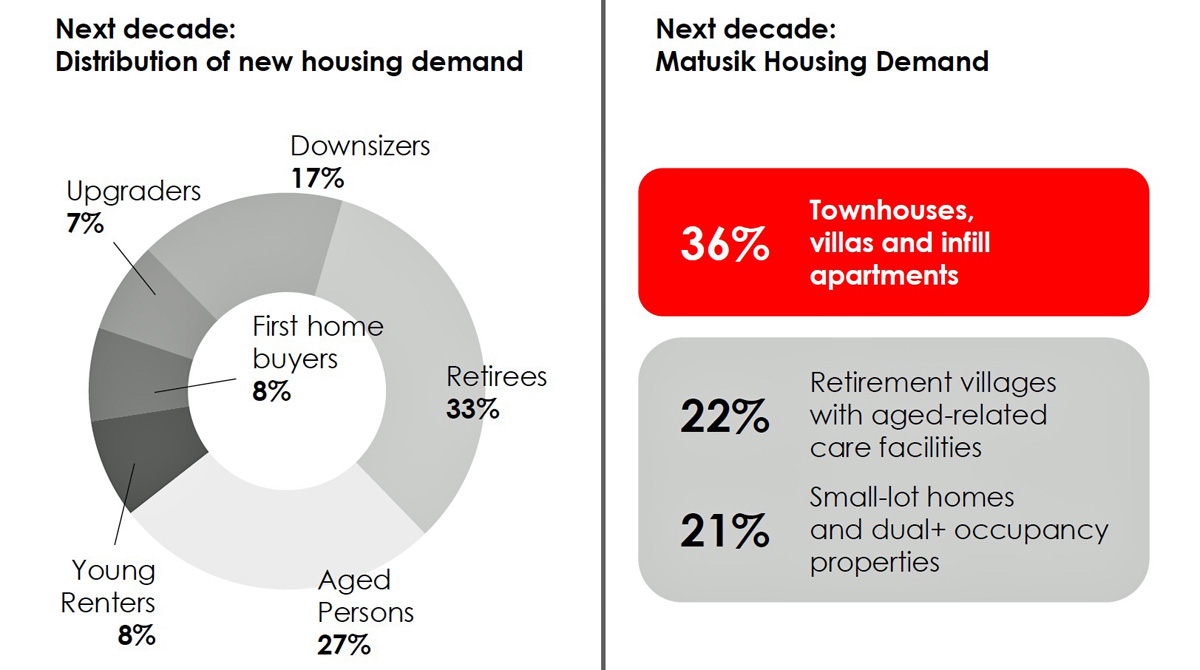
* Over the next decade the distribution of housing need by housing type is:
* 36% – Townhouses/villas and infill apartment projects (typically under 50 apartments per complex)
* 22% – Retirement villages with aged-related care facilities
* 21% – Small-lot homes and houses which facilitate two or more rental incomes
What drives rental growth?
Dwelling rents are also driven on three levels – macro; regional and local. On the macro level, rents are influenced by the wider things – interest rates; the economy; wages; confidence; government policy (including taxation) and exchange rates.
Regionally, rents are swayed by employment; wages, again, and demand/supply balance. New infrastructure projects often affect rents – sometimes substantially – during the construction phase. But unless these new structures create long lasting jobs, set enduring higher wages and really increase convenience, then their continuing impact on rents is questionable.
Locally, again, it is all about supply and demand.
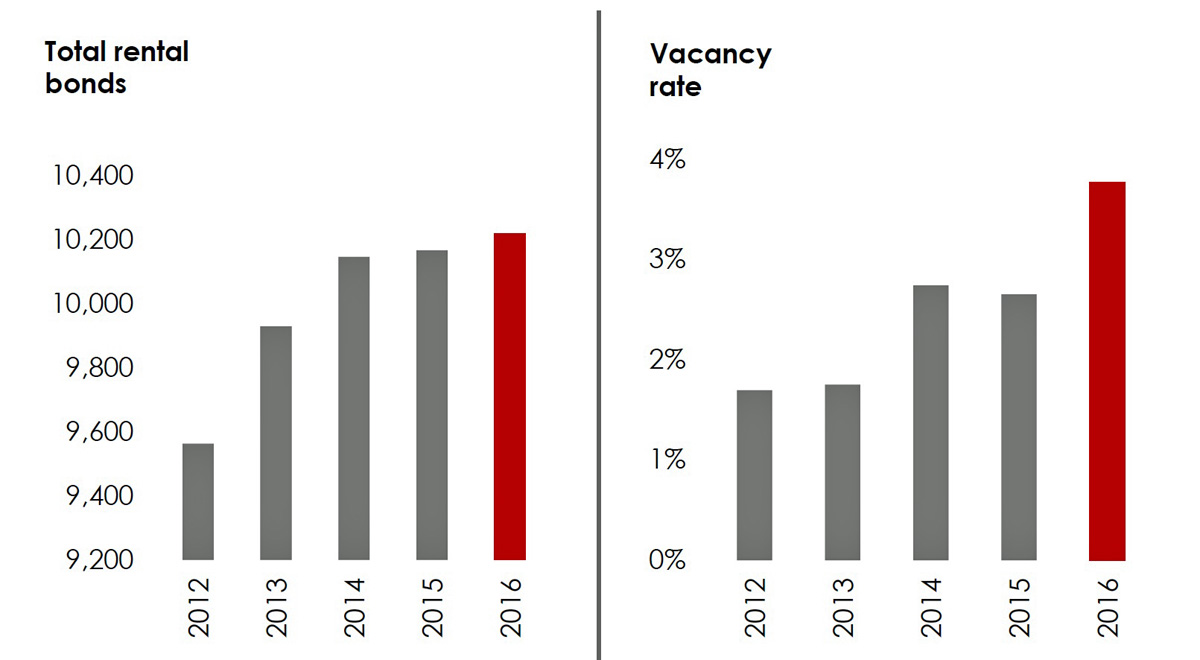
The four ‘rental market’ charts show total bonds held (plus % of households renting); the vacancy rate over time and the annual change (in $ value) in average weekly rents. We have pinpointed the local market’s position on our rental barometer.
Matusik Rental Barometer A market’s position on our Rental Barometer is based on the movement and current position of total rental properties (bonds held) and the vacancy rate in the local area.
Vacancy rate
How we measure rental supply and demand at a local level is to count the number of residential properties available for rent against the total number of rental properties in the same area. This is the vacancy rate and it is expressed as a percentage.
In short, an area with, say, 500 rental properties in total but with 50 of these vacant and available for rent, has a vacancy rate of 10%. But if the same area has just 10 rental properties vacant, then the vacancy rate would be a much healthier 2%. As one would expect, when supply is tight, weekly rents lift. The opposite applies, almost always, when supply is high in relation to demand.
Our vacancy rate benchmarks
* Under 1% – very under supplied – local rents often leap.
* Between 1% and 2% – under supplied – rents typically increase.
* Between 2% and 3% – balanced – little or slow rental growth.
* Between 3% and 5% – oversupplied – rents typically fall.
* Over 5% – very oversupplied – rents can fall substantially. Tenant advice Our tenant recommendations are:
* Vacancy rate under 2% – consider buying or locking into longer lease terms.
* Balanced (2% to 3% vacancy rate) – expect rental increases generally in line with inflation (CPI).
* Vacancy rate over 3% – negotiate better rent, lease terms or premises.
Tenant advice Our tenant recommendations are:
* Vacancy rate under 2% – consider buying or locking into longer lease terms.
* Balanced (2% to 3% vacancy rate) – expect rental increases generally in line with inflation (CPI).
* Vacancy rate over 3% – negotiate better rent, lease terms or premises.
Employment & tourist trends
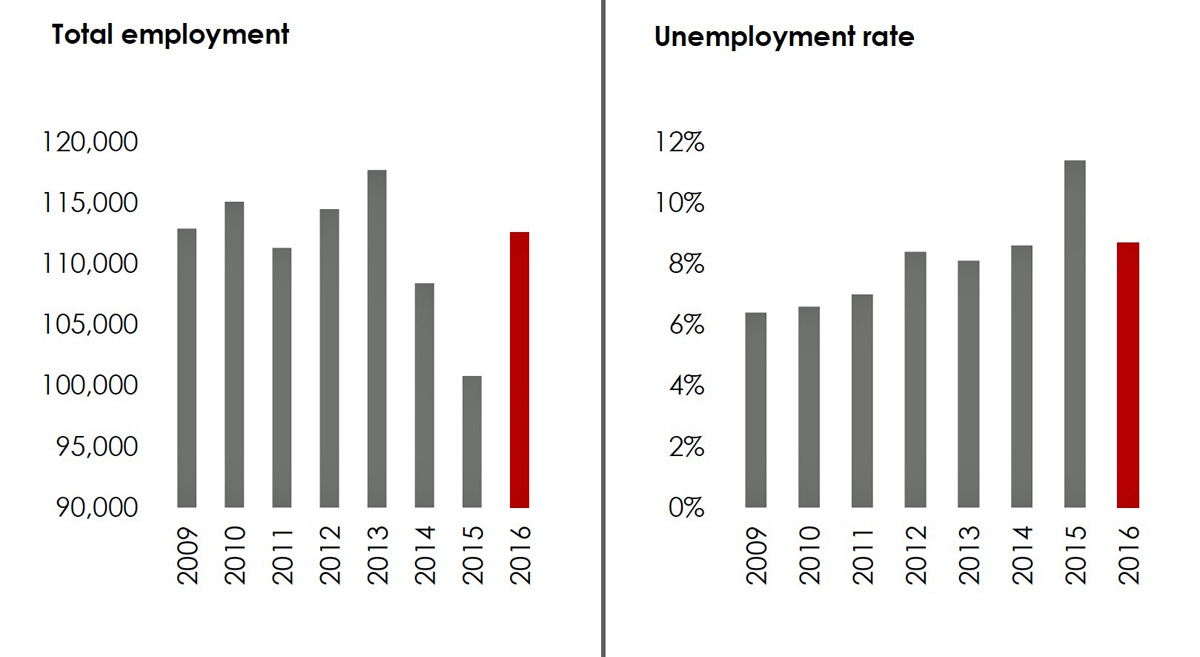
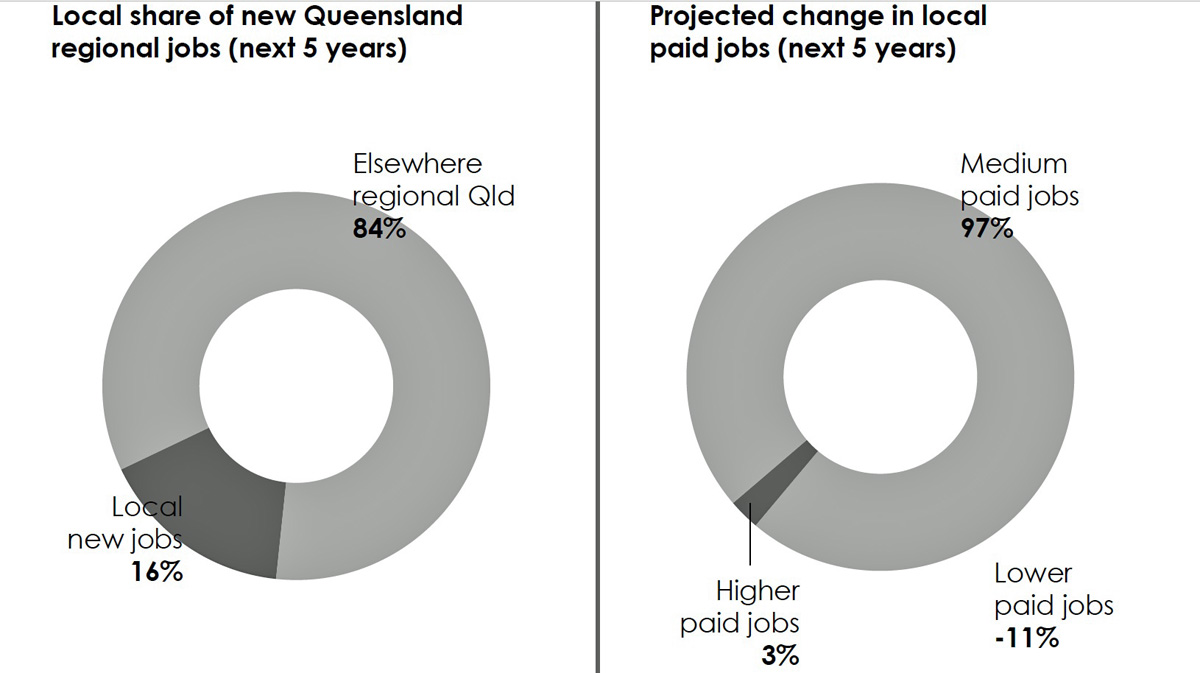
* Close to 112,000 work in the wider regional area. It appears that new jobs are being created in the area and the unemployment rate, whilst high, is falling.
* This is expected to continue with some 5,000 new jobs forecast for the area over the next five years. Most of these new jobs will be in medium paid positions,
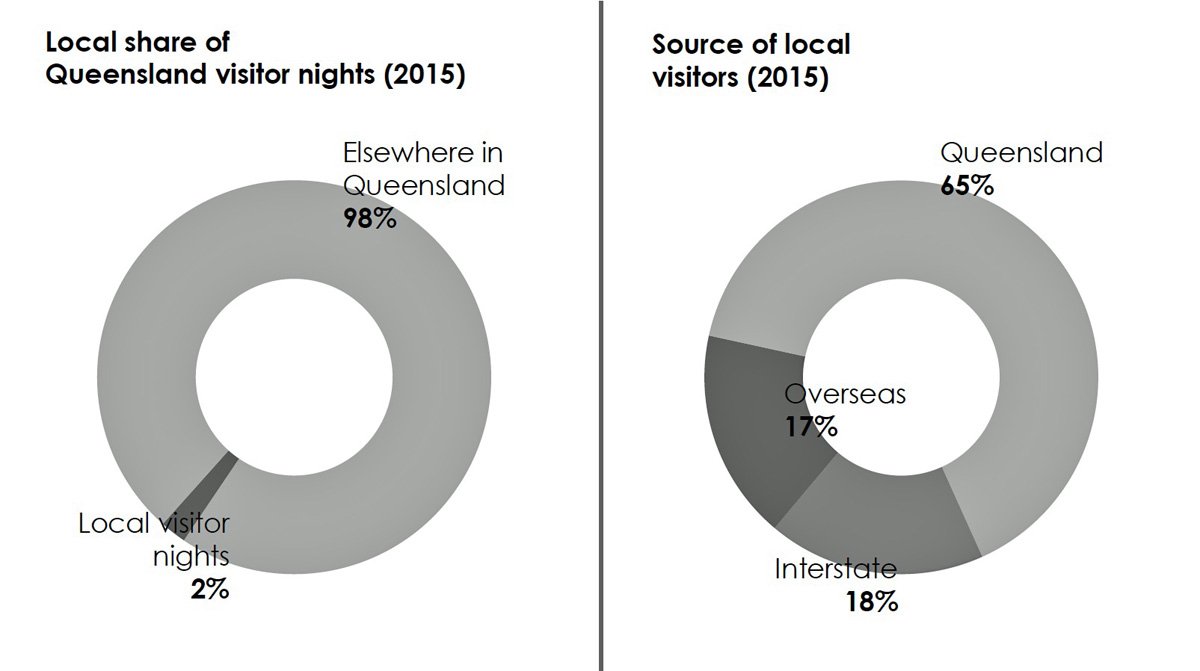
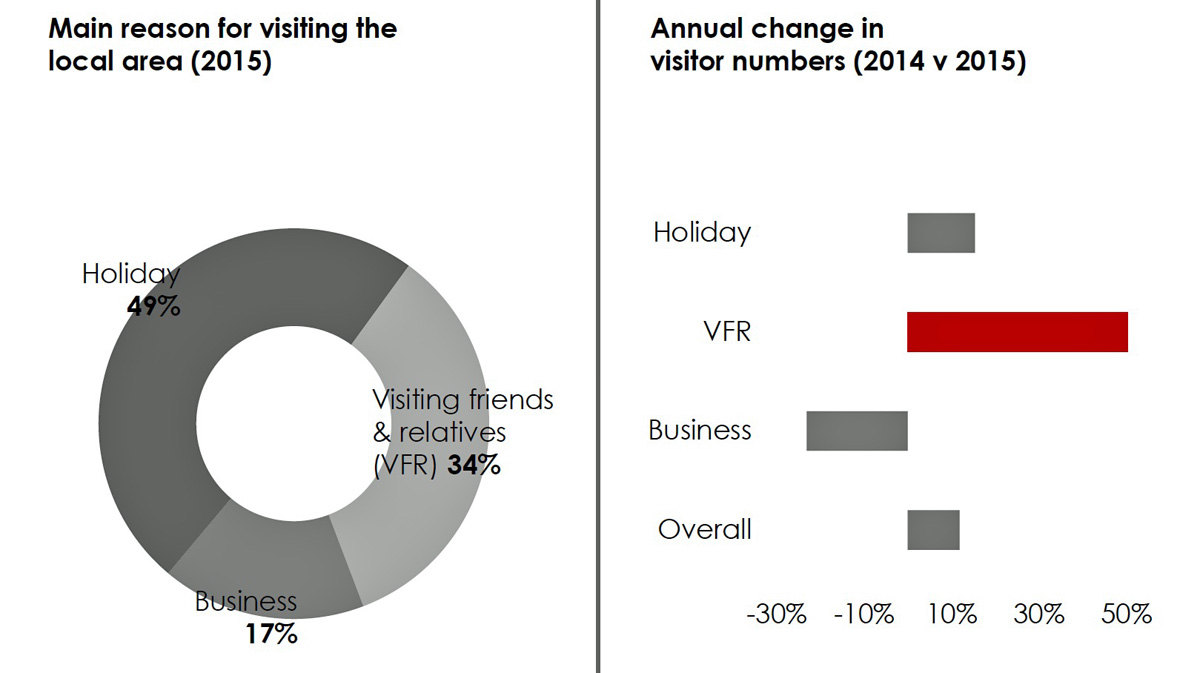
* Just under 750,000 people visit the Fraser Coast each year. Visitor numbers are up 12% on last year. Most of this growth involves people visiting friends and relatives. Business trips to the area declined last year.
What drives price growth?
Dwelling prices are driven on three levels – macro; regional and local. On the macro level, price is influenced by the wider things – interest rates; liquidity; the economy; wages; confidence; government policy; exchange rates and overseas events.
Regionally, dwelling prices are influenced by employment; wages, again, and demand/supply balance. We reluctantly include ‘infrastructure’, as our work has found that unless these new structures create long lasting jobs, set enduring higher wages and really increase convenience, then it’s a real hit and miss when it comes to an enduring impact on local property values.
Locally it is all about supply and demand. The four ‘sales market’ charts show dwelling sales volumes over time; the same for median dwelling values and our estimate of local supply/demand. We also have pinpointed the local market’s position on our property clock.
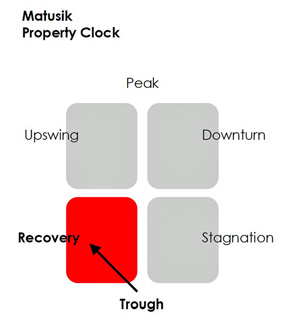
Matusik Property Clock. A market’s position on the property clock is based around the strength and direction of several key real estate indicators including – sales volumes, price and rent momentum, underlying housing demand, new and existing housing supply, employment generation and growth in household income.
Recovery phase
Typically, this phase is mildly favourable to sellers. Our recommendations are:
* Sellers should expect a quick sale; especially if the property is well priced, presented and marketed.
* Buyers need to make sure they don’t overpay, but they can miss out if they take too long.
* Renovators need to understand the market’s limits. Overcapitalisation often happens in recovery locations.
Average time to sell
How we measure supply and demand at a local level is to count the amount of stock for resale against the number of sales during that same period. This is the average time needed to sell. In short, an area with, say, 100 properties listed for sale, but only achieving 20 sales that same year, is in a slump. If we exchange the numbers, then it’s thriving. As one would expect, when supply is tight, dwelling prices lift. The opposite applies, almost always, when supply is high in relation to demand.
Our supply/demand benchmarks
* Under a 3 month supply – very tight, local prices often leap.
* Between 3 and 6 months – supply is considered tight – prices typically increase, but can fall if supply is increasing.
* Between 6 and 12 months – the market is more balanced – meaning no or slow price growth.
* Over 12 months – suggests an oversupply of homes on the market – prices remain stable at best, but often fall.
How do we determine future housing demand?
The Bureau, plus most local government authorities, supplies population projections. Typically, three data sets are provided – a high, medium and low series. We use the medium series. Whilst we chart expected population out to 2036, our focus is on the next ten years. We also compare recent growth trends with those which are forecast. We are always realistic, paring back ambitious population forecasts where necessary, to help determine a credible annualised demographic demand for coming years.
What type of housing will be in demand?
To determine such, we break the projected demographic into six distinct buyer segments. And when determining the most likely demand by housing type, we cross-reference the growth projections for each of our six buyer segments with our model of locational-based dwelling preferences.
Our six buyer segments
* Renters – late teens to mid/late 20s. Important housing considerations: affordability; ability to share; flexibility and low maintenance. Preferred housing options: apartments (inner city); townhouses, duplexes and dual+ occupancy homes (middle-outer suburbs). Buy recommendations: property that can be shared; equal sized bedrooms; ensuites; secure storage and parking.
* First home buyers – typically mid to late 20s to mid/late 30s. Important housing considerations: room to grow; affordability and property improvement. Preferred housing options: some apartments (inner city); some townhouses/duplexes and small houses (middle suburbs); larger detached and dual+ occupancy homes (outer suburbs). Buy recommendations: property that can be improved and able to take in a tenant/s to help pay the mortgage
* Upgraders – mid to late 30s to mid/late 50s. Having kids later means that many, even well into their 50s, have teenagers at home. Important housing considerations: space; room to grow; improving the property. Preferred housing options: larger apartments (inner city); traditional detached and some dual+ occupancy homes (middle-outer suburbs). Buy recommendations: larger homes close to infrastructure or in boutique projects in high amenity locations.
* Downsizers – mid/late 50s to mid/late 60s. As their title suggests, many want to move into something smaller and, if possible, in their existing neighbourhood. Important housing considerations: low maintenance; convenience; like- minded residents; existing location; small projects. Preferred housing options: spacious apartments (inner city); townhouses/villas and dual+ occupancy homes (middle-outer suburbs). Buy recommendations: value for money, small complexes; private; secure and with space for visitors and grandchildren.
* Retirees – mid 60s to mid/late 70s, sometimes older. Living in compact housing also suits this segment. Important housing considerations: affordability; low maintenance; convenience; like minded residents; quiet location; smaller projects and pets. Preferred housing options: apartments in small complexes; townhouses; duplexes and dual+ occupancy homes. Buy recommendations: quality homes; small complexes; private; secure; room for visitors and pet friendly.
* Aged – mid to late 70s and older. At this age, assistance is often required. Important housing considerations: affordability; assistance; low maintenance; quiet location and pets. Preferred housing options: homes in small to medium sized complexes and some dual+ occupancy homes. Buy recommendations: medical assistance; affordable homes; private space; secure common grounds and pet friendly, if possible.
New housing supply
The new residential market across much of the country, and in particular across the south east corner of Queensland, was in equilibrium in 2012. This means that new supply, at that time, was roughly equal to underlying demand – i.e. the need to build more new homes. Our chart for ‘underlying housing demand versus new housing supply’ starts at this past equilibrium point. It is important to note that new housing supply – i.e. dwelling commencements – is cumulative, meaning that if they are not sold and/or occupied in one particular year, they remain in the supply pipeline until they are ‘consumed’. Our chart here depicts this local trend, allowing us to determine the level of local new housing under or oversupply.
Our new housing supply benchmarks
* Negative 25% or lower = undersupplied
* Negative 25% to 25% = balanced
* 25% to 50% = oversupplied
* Over 50% = very oversupplied
Employment trends
Job creation is increasingly important for future property performance. Those areas with limited employment opportunities are likely to struggle with regard to future capital growth and rental returns. The opposite trends take place in locations with an increasing, and more importantly, upwardly mobile workforce. Important in this regard is the level of education and local skill set. This, in turn, impacts on the type of jobs in an area and the potential prospect of more higher paying jobs in the future. More higher skilled jobs typically equate to rising local household income. Rising local household incomes translate to sustainable increases in property values and weekly rent. This is not to say that areas with medium or lower jobs and workers do not present investment opportunities. They do, but the room for potential buying error in these areas, we believe, is higher. Our local employment benchmarks make comparisons with the SEQld or Queensland average.


Report coverage This report covers four geographic areas:
* Fraser Coast Region
* The Wide Bay Region
* Fraser Coast Regional Council
* Postcodes 4650, 4655 and 4659
Risks of investing in property
Direct investment in residential property, like all investments, involves a number of risks. If these eventuate, your income might be lower than expected. There may even be none. In addition, the capital value of your investment could fall. The key risks of investing in property are outlined below:
* The property purchased may not provide the income or capital gains the asset was expected to produce.
* There is a risk that your property may, for periods of time, lie vacant and hence not generate income. Maintenance and repair costs are the investor’s responsibility and can vary, and at times be significant. Such costs are sometimes recoverable from rental bonds or under insurance policies.
* There are a number of factors that affect the general property market including increases in supply and falls in demand; the cyclical nature of property values; increases in taxes and operating expenses; overall economic conditions; demographic changes; changes in town planning laws; casualty and condemnation losses; environmental risks; regulation on rents; detrimental new developments in the area; increases in interest rates; similarly, inflation and changes to bank funding policies.
* Gearing increases the volatility in the value of your investment. In the early stages of residential investment, a significant fall in the property’s value may see balances fall to less than the total amount of borrowings.
* Increases in interest rates often increase the cost of borrowings.
* Changes in laws or their interpretations including taxation, superannuation and corporate regulatory laws, practice and policy could have an impact on your investment. You should seek professional tax advice before investing in residential property.
Matusik Property Insights Michael Matusik has been providing independent real estate advice for over 25 years. Michael is the director of Matusik Property Insights. We specialise in new project advice.
* Consultancy & advice on over 550 new residential projects
* Delivery of more than 840 property presentations
* Author of more than 2,200 property publications
* Active member of the Future Housing Taskforce
* Trusted industry expert with a wide and growing following For more information www.matusik.com.au This report is valid for Financial 2017.
Disclaimer
This report has been prepared by Matusik Property Insights Pty Ltd. This content has been prepared without taking into account the objectives, financial situation or needs of any particular individual. It does not constitute formal advice. For this reason, any individual should, before acting, consider the appropriateness of the information, having regard to the individual’s objectives, financial situation and needs, and if necessary, seek appropriate professional advice.
Information herein includes material obtained from third parties considered to be accurate. Whilst this information has been carefully compiled, no warranty or promise as to its correctness is made or intended. Interested parties should undertake independent inquiries and investigations to satisfy themselves that any details herein are true and correct.
In addition, no forecasts are being made about an individual’s potential capital gains or rental returns. Matusik Property Insights Pty Ltd disclaims all liability for any loss or damage suffered by any person of, or in connection with, the provision of information herewith, or the purported reliance thereon by any person.
Copyright + trademarks
Reprinting, republication or distribution of any portion of this document is strictly prohibited. Financial penalties apply for any unauthorised reuse. Contact us for our reuse terms.
Seven Reasons Why, Property Pick, Ten Things You Need To Know About, Property Rationale and ‘Short Black’ Property Reports are trademarks of Matusik Property Insights Pty Ltd. Registered copyright nos. 103812, 10353 and 10354. Registration pending on Property Rationale and ‘Short Black’ Property Reports. All rights reserved.
Typical data sources
MPI; Qld Government; Qld RTA; REIA; REIQ; SQM Research; BCI Australia: ABS; realestate.com and RPData.
